Dashboard
Sortie ships a self-contained HTML dashboard at / on the same port as the JSON API and Prometheus metrics. No external tools, no JavaScript frameworks, no CDN dependencies - one HTML page rendered server-side by Go’s html/template engine with vanilla JavaScript for interactive behavior.
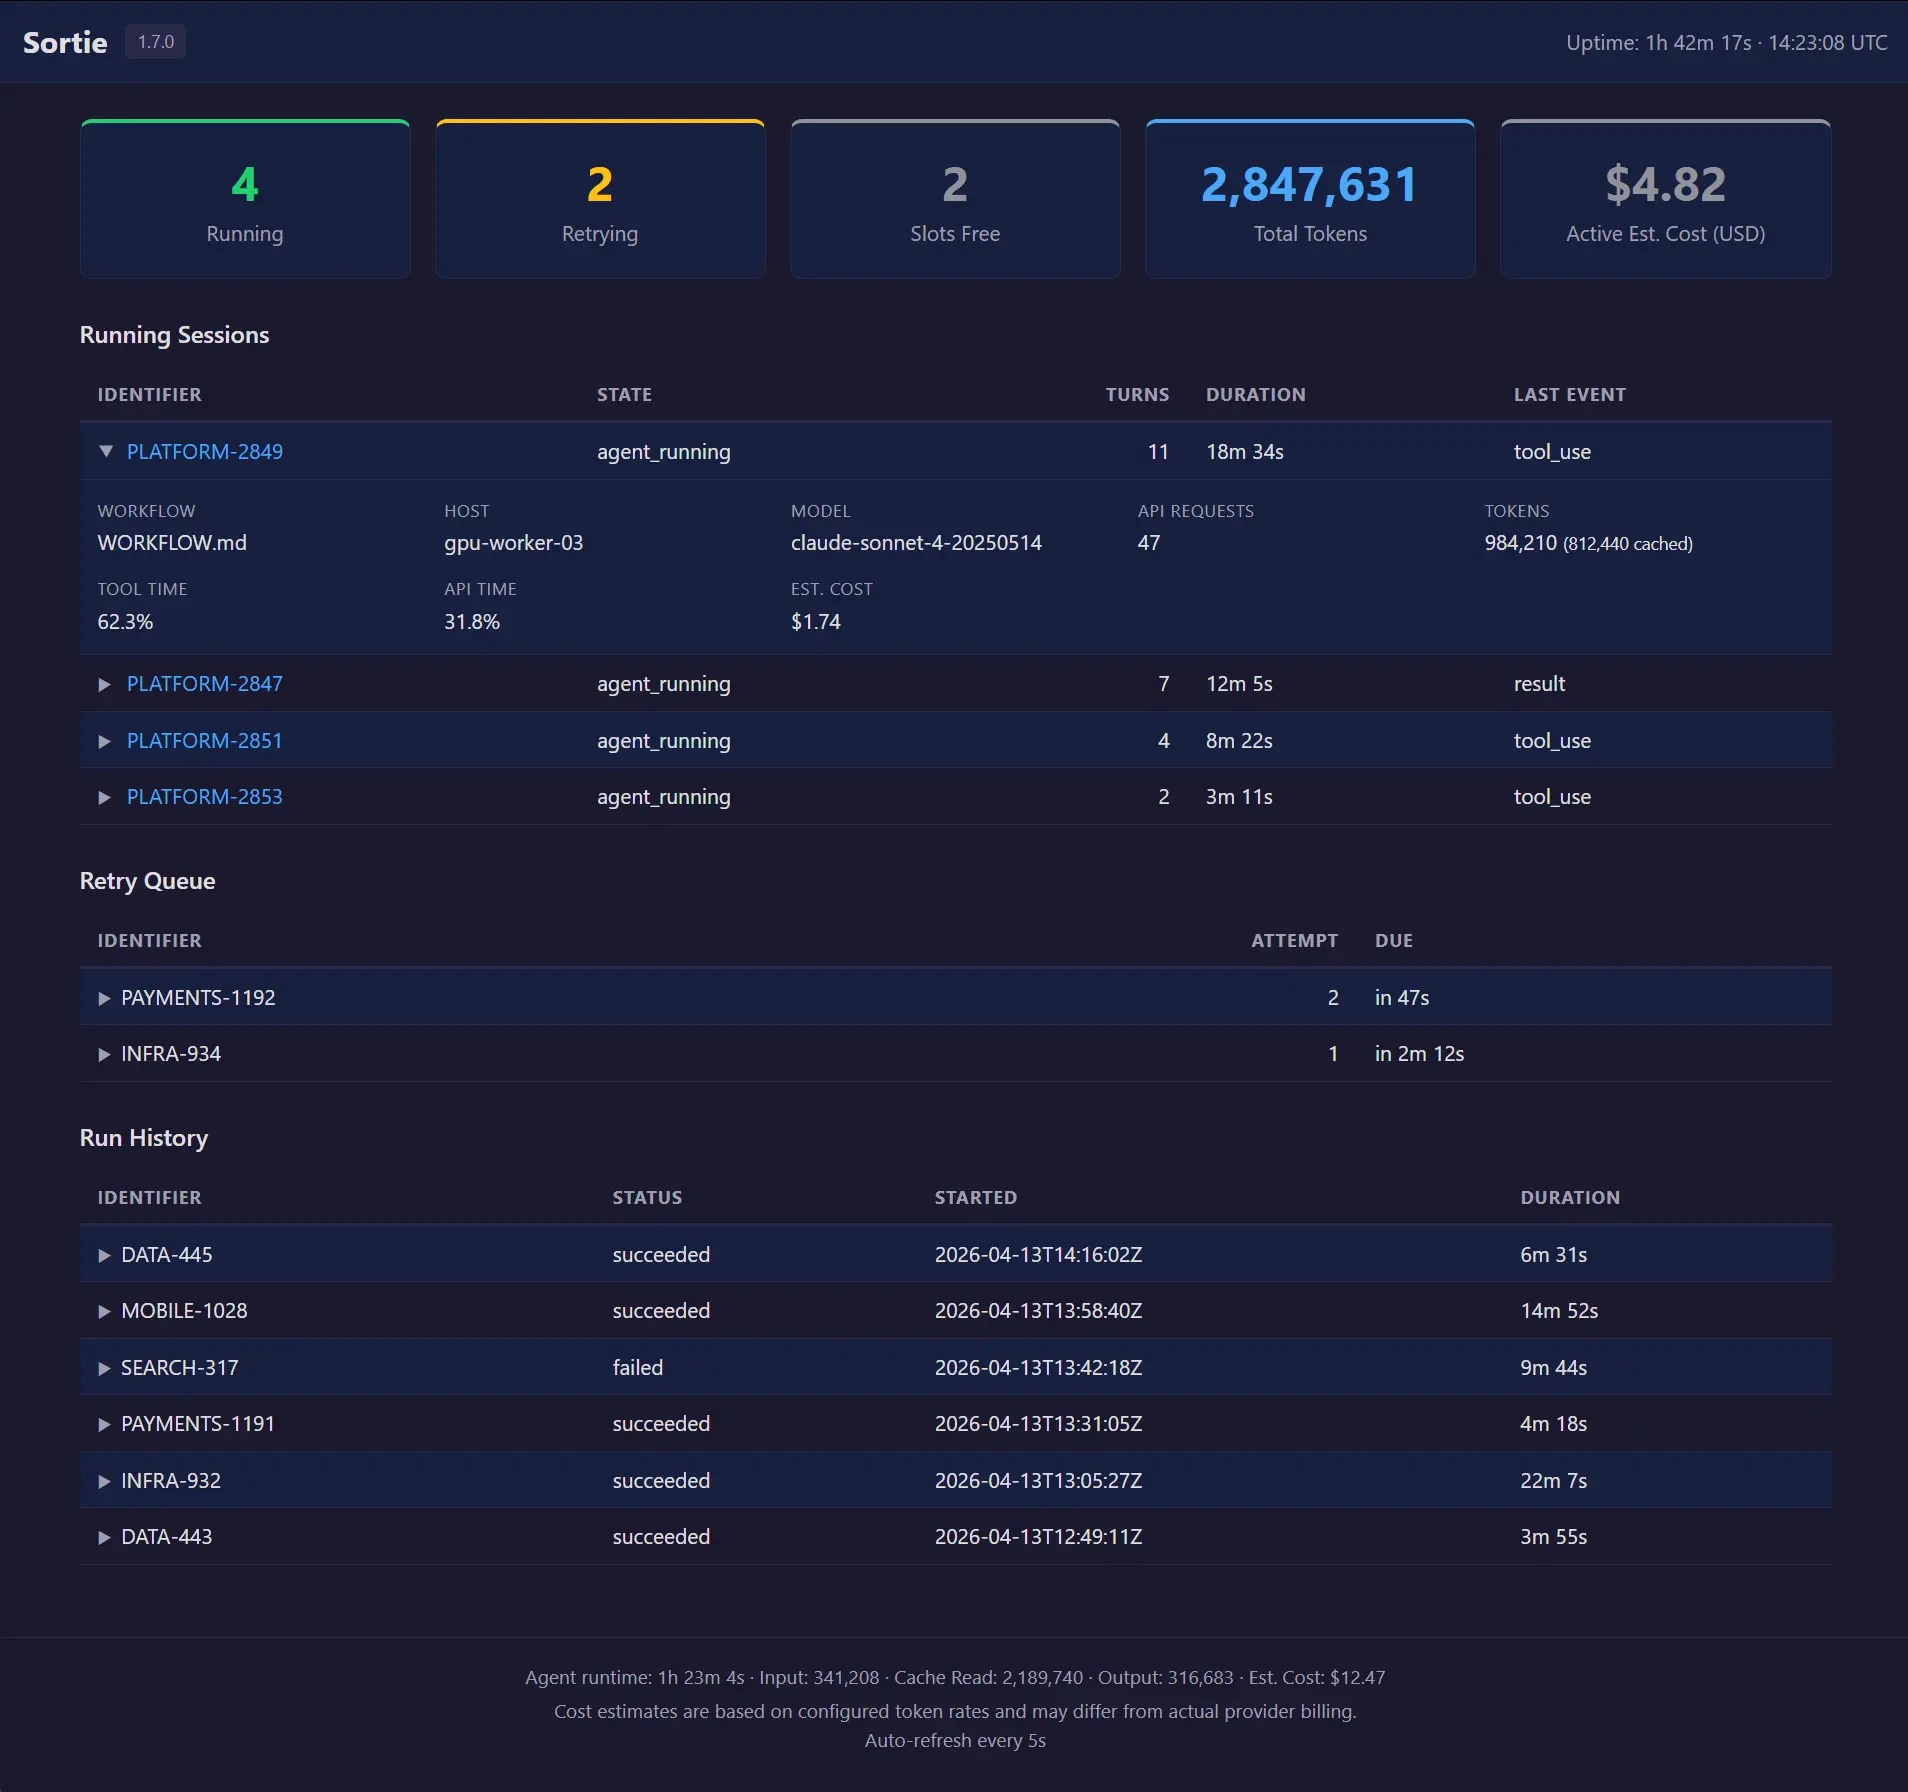
The dashboard is designed for local, at-a-glance monitoring. Open it in a browser while Sortie runs, and you see what is happening right now: which agents are working, how many tokens they have consumed, what is waiting for retry, and how past runs ended. Tables use an accordion pattern - each row shows primary identification and status fields, and clicking a row expands an inline detail panel with secondary fields. All rows are collapsed by default. The page auto-refreshes every 5 seconds via an HTML <meta http-equiv="refresh"> tag.
The dashboard supports light and dark modes automatically via prefers-color-scheme. No toggle is needed.
Accessing the dashboard
The dashboard is available when the HTTP server is running. By default, Sortie starts the server on 127.0.0.1:7678 - open http://127.0.0.1:7678/ in a browser.
Override the port or bind address with CLI flags:
sortie --port 9090 WORKFLOW.mdOr set server.port in the WORKFLOW.md front matter:
---
server:
  port: 9090
---
To disable the server entirely, pass --port 0. For the full server extension schema, see WORKFLOW.md configuration reference.
Network access
Sortie binds to 127.0.0.1 by default. The dashboard is accessible on the machine where Sortie is running - not from other hosts on the network. This is intentional: Sortie is a local orchestration tool, and the dashboard is a local monitoring surface.
For container deployments or when Sortie runs on a remote host, pass --host 0.0.0.0 to listen on all interfaces. Alternatively, place a reverse proxy such as Nginx in front of it and forward traffic to the local port. Secure the proxy with authentication; Sortie’s HTTP server has no built-in auth.
For production monitoring across multiple hosts, use the Prometheus /metrics endpoint with a Prometheus server and Grafana dashboards. Prometheus is built for aggregated, historical, alertable monitoring - the dashboard is not.
Header
The top bar displays:
| Element | Description |
|---|---|
| Sortie | Application name. |
| Version badge | Build version string (e.g., 1.11.0). Shows dev when running an untagged build. |
| Uptime | Wall-clock time since the process started, formatted as Xd Xh Xm or Xh Xm Xs. |
| Timestamp | UTC time when the snapshot was generated, in HH:MM:SS UTC format. |
Summary cards
Four cards across the top provide the high-level picture. A fifth card appears when token rates are configured.
| Card | Color | Value | Condition | Description |
|---|---|---|---|---|
| Running | Green | Integer | Always | Number of agent sessions currently executing. Maps to sortie_sessions_running in Prometheus. |
| Retrying | Yellow | Integer | Always | Number of issues in the retry queue - waiting for their next attempt after an error, continuation, or stall timeout. Maps to sortie_sessions_retrying. |
| Slots Free | Gray | Integer | Always | Remaining dispatch capacity: max_concurrent_agents − running. When this reaches 0, the orchestrator waits for a running session to finish before dispatching the next issue. |
| Total Tokens | Blue | Integer (comma-formatted) | Always | Cumulative LLM tokens consumed across all sessions since startup. Includes input, output, and cache-read tokens. |
| Active Est. Cost (USD) | Neutral | USD string | token_rates configured | Estimated cost across currently running sessions, computed from configured per-token rates. Shows an em dash when no running session matches a configured rate. See cost estimation. |
Accordion row detail
All three tables (Running Sessions, Retry Queue, Run History) use an accordion pattern. Each data row consists of two HTML <tr> elements: a collapsed header row showing primary fields, and a hidden detail row containing secondary fields in a definition list grid.
Interaction
- Click any row (except links) to toggle its detail panel open or closed.
- Keyboard: focus a row with Tab, then press Enter or Space to toggle.
- Links inside rows (e.g., the Identifier link in Running Sessions) navigate normally - they do not trigger the accordion.
Expand indicator
Each row’s first cell is prefixed with a small triangle (▶) that rotates 90° when the row is expanded. This provides visual affordance that the row is interactive.
State persistence across refresh
The page auto-refreshes every 5 seconds. Expanded rows are remembered across refreshes using the browser’s sessionStorage under the key sortie-expanded. Each row is identified by a stable key derived from its table and identifier (e.g., running:MT-649, retry:MT-649, history:MT-649:2). On page load, previously expanded rows are automatically re-opened. Stale keys for rows that no longer exist are pruned. Closing the browser tab clears the stored state.
Accessibility
| Attribute | Purpose |
|---|---|
aria-expanded | Announces expanded or collapsed state to screen readers. |
aria-controls | Associates the header row with its detail panel by id. |
aria-hidden | Hides the collapsed detail row from assistive technology. |
role="button" | Signals the row is interactive. |
tabindex="0" | Makes the row keyboard-focusable. |
A :focus-visible outline matches the link color. The prefers-reduced-motion media query disables all CSS transitions.
Table striping
Row striping uses a CSS class (row-even) applied via a Go template function rather than nth-child, because the interleaved detail rows would break CSS child counting.
Running sessions table
Lists every agent session that is actively executing. Sorted by start time (oldest first). Each row links to the per-issue JSON detail endpoint.
Collapsed row columns (always visible)
| Column | Description |
|---|---|
| Identifier | Issue identifier (e.g., MT-649). Clicking the link opens GET /api/v1/{identifier} in the browser. Prefixed with an expand indicator (▶). |
| State | Current orchestrator state for this issue (e.g., agent_running). |
| Turns | Number of agent turns completed in this session. A turn is one prompt–response cycle. |
| Duration | Wall-clock time since the session started, formatted as Xh Xm Xs or Xm Xs. |
| Last Event | Most recent agent event type received (e.g., result, tool_use). |
Detail panel fields (visible when expanded)
| Field | Description |
|---|---|
| Workflow | Name of the WORKFLOW.md file that dispatched this session. Shows an em dash when unavailable. |
| Host | SSH host where the agent is running. This field appears only when at least one session uses an SSH host. Shows local for sessions running on the same machine as Sortie. |
| Model | LLM model name reported by the agent (e.g., claude-sonnet-4-20250514). Shows an em dash when the agent has not reported a model. |
| API Requests | Number of API requests the agent has made to the LLM provider. |
| Tokens | Total tokens consumed by this session. When cache-read tokens are nonzero, they appear in parentheses (e.g., 12,450 (8,200 cached)). |
| Est. Cost | Estimated cost for this session based on configured token rates. Shows an em dash when token rates are not configured for this session’s agent adapter kind. This field appears only when token_rates is configured. |
| Tool Time | Percentage of elapsed wall-clock time the agent spent in tool calls. Shows N/A until the session has both elapsed time and recorded tool time. |
| API Time | Percentage of elapsed wall-clock time the agent spent waiting for LLM API responses. Shows N/A until both elapsed time and API time are recorded. |
When no sessions are running, the table is replaced with a centered “No running sessions” message.
Retry queue table
Lists issues that are waiting for their next session attempt. Sorted by due time (soonest first).
Collapsed row columns
| Column | Description |
|---|---|
| Identifier | Issue identifier. Prefixed with an expand indicator (▶). |
| Attempt | The attempt number for the upcoming retry (e.g., 2 means the first attempt failed and this is the second try). |
| Due | Time until the retry fires, relative to the snapshot timestamp. Shows in Xm Xs, now, or overdue. |
Detail panel fields
| Field | Description |
|---|---|
| Error | Error message from the previous failed attempt. Displayed at full width in the detail panel without truncation. |
When no retries are pending, the table is replaced with “No retries pending.”
Run history table
Lists recently completed session attempts - both successful and failed. Shows the last 25 entries. This section appears only when run history data is available (requires persistence to be enabled).
Collapsed row columns
| Column | Description |
|---|---|
| Identifier | Issue identifier. Prefixed with an expand indicator (▶). |
| Status | Outcome of the attempt (e.g., completed, error, cancelled). |
| Started | RFC 3339 timestamp when the session started. |
| Duration | Wall-clock time from start to completion. Computed from the start and completion timestamps. |
Detail panel fields
| Field | Description |
|---|---|
| Attempt | Which attempt number completed (1-based). The first dispatch is 1, the first retry is 2, and so on. |
| Turns | Number of agent turns completed in this session. A turn is one prompt–response cycle. |
| Workflow | WORKFLOW.md file used for this run. Shows an em dash when unavailable. |
| Error | Error message, if the attempt failed. Shows an em dash for successful attempts. Displayed at full width without truncation. |
Footer
The footer displays aggregate statistics across all sessions since startup:
| Element | Description |
|---|---|
| Agent runtime | Cumulative wall-clock time agents have spent running, formatted as Xh Xm Xs. |
| Input | Total input tokens consumed (comma-formatted). |
| Cache | Total cache-read tokens (comma-formatted). |
| Output | Total output tokens consumed (comma-formatted). |
| Est. Cost | Estimated cost across running sessions. Appears only when token_rates is configured. Shows an em dash when no running session matches a configured rate. |
| Auto-refresh | Reminder that the page refreshes every 5 seconds. |
When token_rates is configured, a disclaimer line appears below the aggregate stats: “Cost estimates are based on configured token rates and may differ from actual provider billing.”
Cost estimation
The dashboard displays estimated USD cost when token_rates is configured in WORKFLOW.md front matter. Without token_rates, the dashboard shows raw token counts only - no cost figures appear anywhere.
Cost is computed at render time from per-session token counts and the configured rate for each session’s agent adapter kind. No cost data is persisted. The formula for a single session:
The aggregate cost card sums per-session costs across currently running sessions. It does not include historical sessions because the aggregate_metrics table stores unpartitioned global token totals without an agent-kind dimension - applying a single rate to lifetime totals would produce misleading numbers when the workspace has used multiple adapter kinds with different pricing.
Each running session’s cost is resolved using the agent adapter kind captured at dispatch time (e.g., claude-code, copilot-cli). When a session’s adapter kind does not match any configured rate, that session contributes no cost and shows an em dash in the detail panel.
Cost values are formatted with two decimal places (e.g., $1.47). Values above $1,000 use comma separators (e.g., $1,234.56). Values below $0.01 show as $0.00.
For token rate configuration syntax, see the token_rates extension reference.
Temporary unavailability
If the orchestrator’s state snapshot fails (e.g., during shutdown), the dashboard returns HTTP 503 with a minimal HTML page that reads “Dashboard temporarily unavailable” and auto-refreshes in 5 seconds. No manual reload is needed.
If the Go template execution fails (an internal error), the dashboard returns HTTP 500 with a similarly minimal auto-refreshing error page.
Was this page helpful?