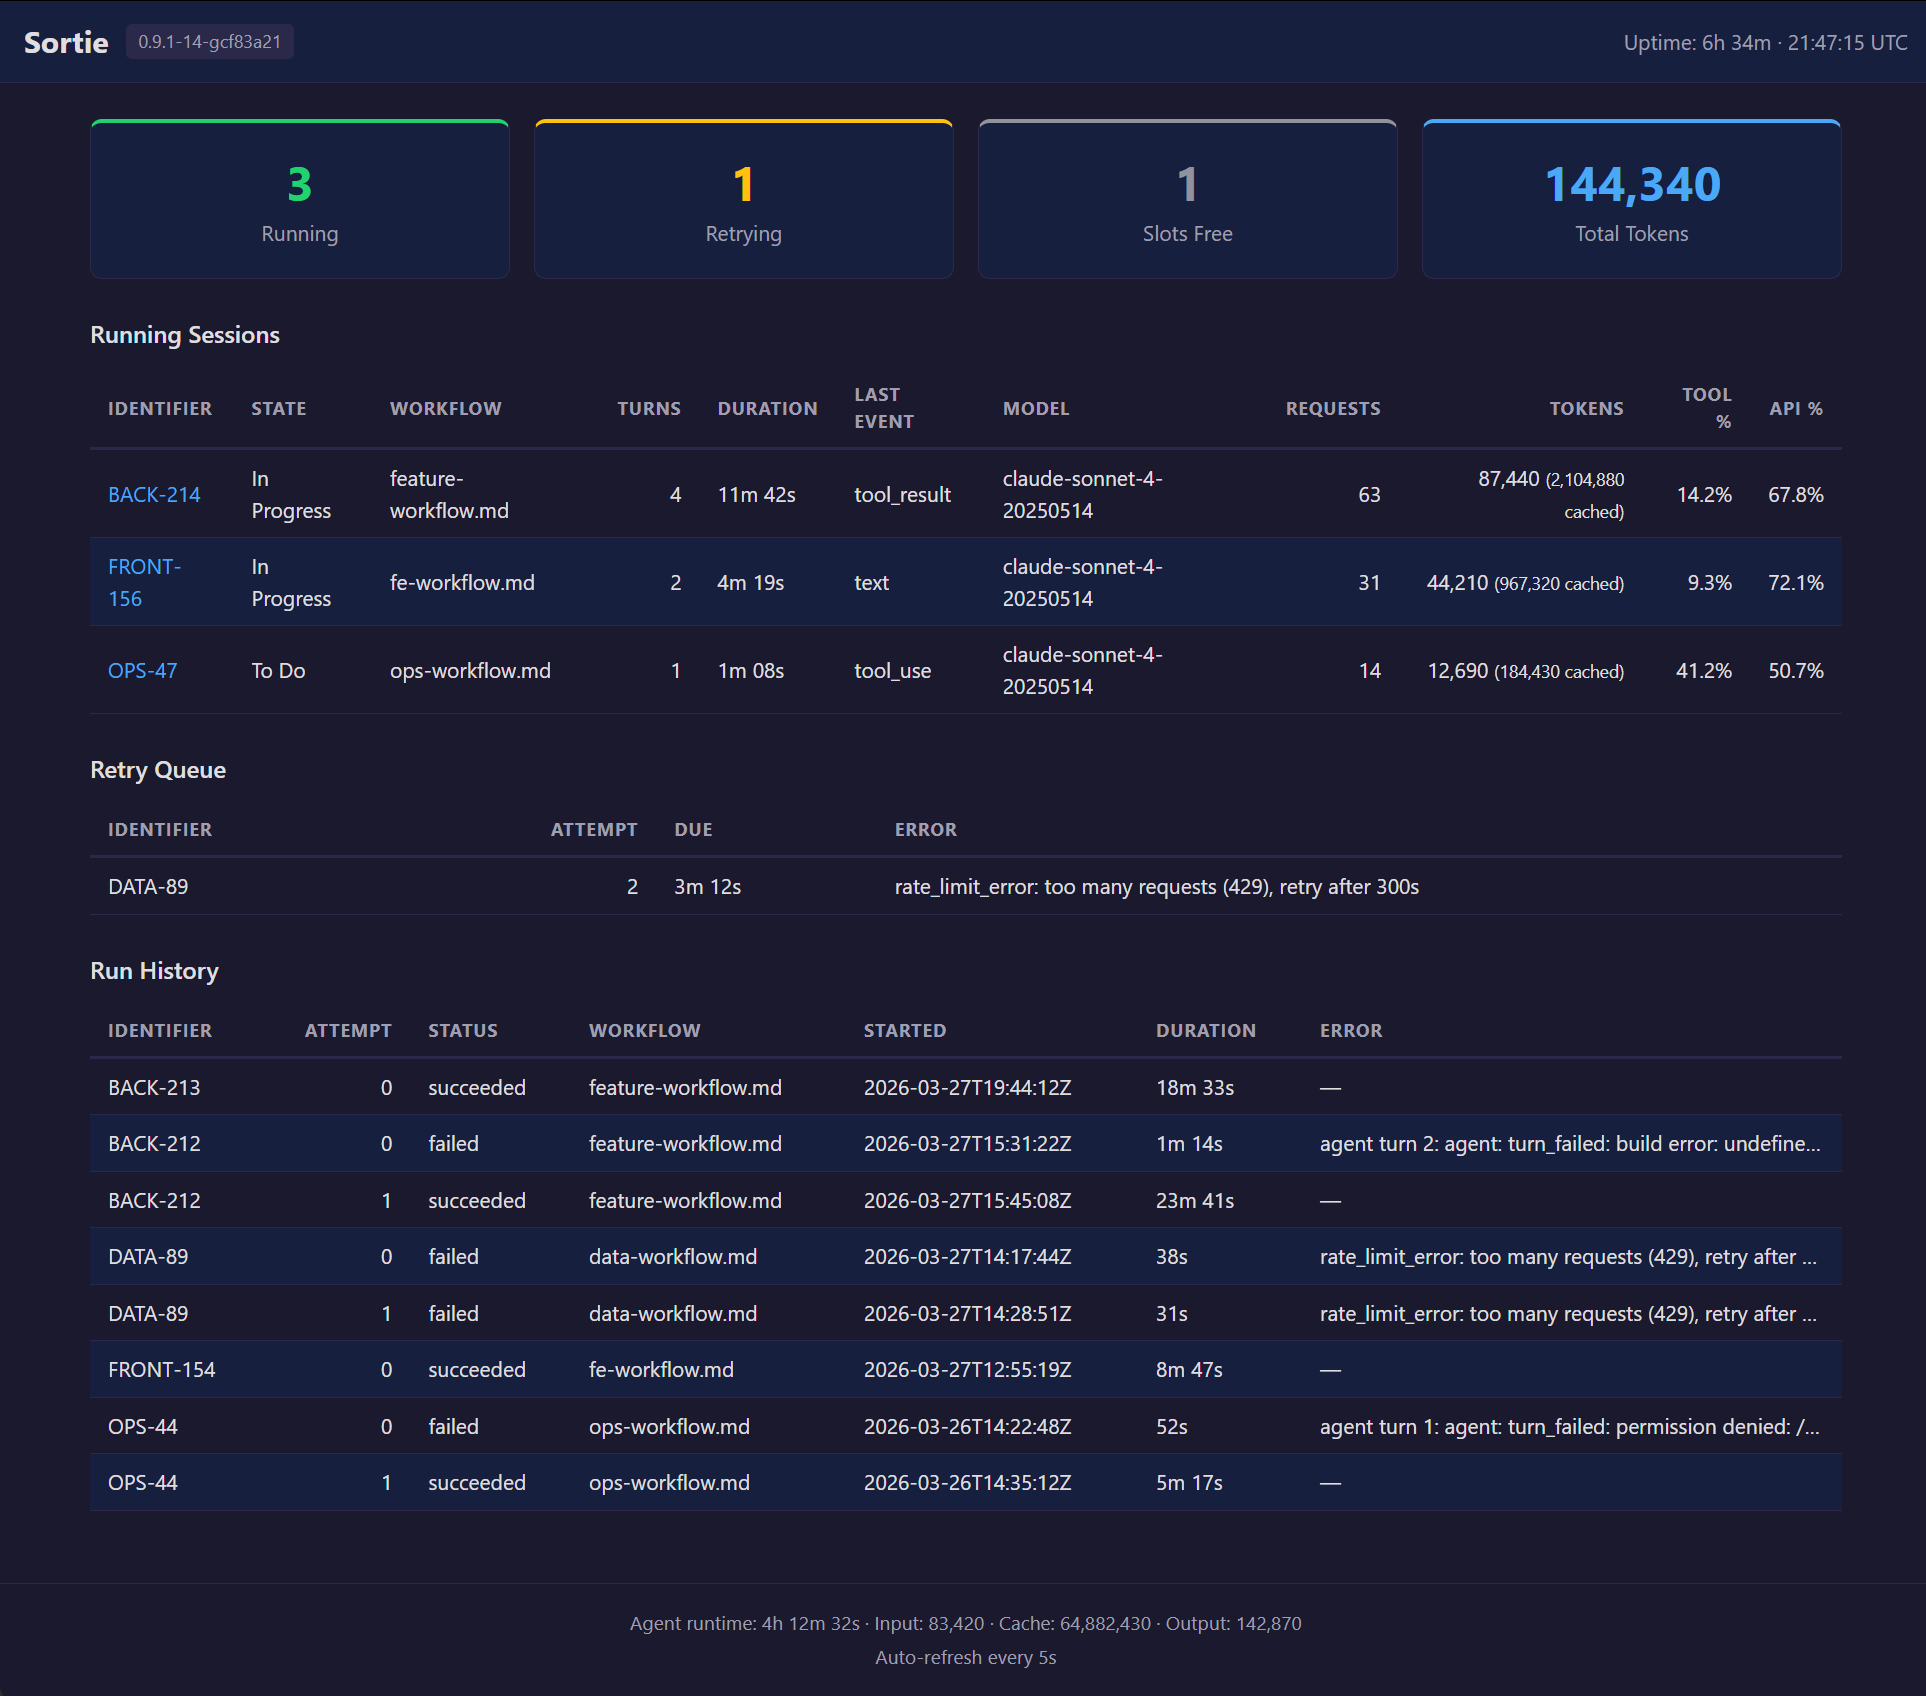
Sortie ships a self-contained HTML dashboard at / on the same port as the JSON API and Prometheus metrics. No external tools, no JavaScript frameworks, no CDN dependencies — one HTML page rendered server-side by Go's html/template engine.
The dashboard is designed for local, at-a-glance monitoring. Open it in a browser while Sortie runs, and you see what is happening right now: which agents are working, how many tokens they have consumed, what is waiting for retry, and how past runs ended. It auto-refreshes every 5 seconds via an HTML <meta http-equiv="refresh"> tag — no WebSocket, no polling script.
The dashboard supports light and dark modes automatically via prefers-color-scheme. No toggle is needed.
Enabling the dashboard
The dashboard is available when the HTTP server is enabled. Pass --port at launch:
sortie --port 8080 WORKFLOW.md
Or set server.port in the WORKFLOW.md front matter:
---
server:
  port: 8080
---
Then open http://127.0.0.1:8080/ in a browser.
For the full server extension schema, see WORKFLOW.md configuration reference.
Network access
Sortie binds to 127.0.0.1 only. The dashboard is accessible on the machine where Sortie is running — not from other hosts on the network. This is intentional: Sortie is a local orchestration tool, and the dashboard is a local monitoring surface.
If you need remote access to the dashboard — for example, when running Sortie on a cloud VM — place a reverse proxy such as Nginx in front of it and forward traffic to the local port. This is a standard deployment pattern but falls outside Sortie's scope. Secure the proxy with authentication; Sortie's HTTP server has no built-in auth.
For production monitoring across multiple hosts, use the Prometheus /metrics endpoint with a Prometheus server and Grafana dashboards. Prometheus is built for aggregated, historical, alertable monitoring — the dashboard is not.
Header
The top bar displays:
| Element | Description |
|---|---|
| Sortie | Application name. |
| Version badge | Build version string (e.g., 0.0.9). Shows dev when running an untagged build. |
| Uptime | Wall-clock time since the process started, formatted as Xd Xh Xm or Xh Xm Xs. |
| Timestamp | UTC time when the snapshot was generated, in HH:MM:SS UTC format. |
Summary cards
Four cards across the top provide the high-level picture.
| Card | Color | Value | Description |
|---|---|---|---|
| Running | Green | Integer | Number of agent sessions currently executing. Maps to sortie_sessions_running in Prometheus. |
| Retrying | Yellow | Integer | Number of issues in the retry queue — waiting for their next attempt after an error, continuation, or stall timeout. Maps to sortie_sessions_retrying. |
| Slots Free | Gray | Integer | Remaining dispatch capacity: max_concurrent_agents − running. When this reaches 0, the orchestrator waits for a running session to finish before dispatching the next issue. |
| Total Tokens | Blue | Integer (comma-formatted) | Cumulative LLM tokens consumed across all sessions since startup. Includes input, output, and cache-read tokens. |
Running sessions table
Lists every agent session that is actively executing. Sorted by start time (oldest first). Each row links to the per-issue JSON detail endpoint.
| Column | Description |
|---|---|
| Identifier | Issue identifier (e.g., MT-649). Clicking the link opens GET /api/v1/{identifier} in the browser. |
| State | Current orchestrator state for this issue (e.g., agent_running). |
| Workflow | Name of the WORKFLOW.md file that dispatched this session. Shows an em dash when unavailable. |
| Host | SSH host where the agent is running. This column appears only when at least one session uses an SSH host. Shows local for sessions running on the same machine as Sortie. |
| Turns | Number of agent turns completed in this session. A turn is one prompt–response cycle. |
| Duration | Wall-clock time since the session started, formatted as Xh Xm Xs or Xm Xs. |
| Last Event | Most recent agent event type received (e.g., result, tool_use). |
| Model | LLM model name reported by the agent (e.g., claude-sonnet-4-20250514). Shows an em dash when the agent has not reported a model. |
| Requests | Number of API requests the agent has made to the LLM provider. |
| Tokens | Total tokens consumed by this session. When cache-read tokens are nonzero, they appear in parentheses (e.g., 12,450 (8,200 cached)). |
| Tool % | Percentage of elapsed wall-clock time the agent spent in tool calls. Shows N/A until the session has both elapsed time and recorded tool time. |
| API % | Percentage of elapsed wall-clock time the agent spent waiting for LLM API responses. Shows N/A until both elapsed time and API time are recorded. |
When no sessions are running, the table is replaced with a centered "No running sessions" message.
Retry queue table
Lists issues that are waiting for their next session attempt. Sorted by due time (soonest first).
| Column | Description |
|---|---|
| Identifier | Issue identifier. |
| Attempt | The attempt number for the upcoming retry (e.g., 2 means the first attempt failed and this is the second try). |
| Due | Time until the retry fires, relative to the snapshot timestamp. Shows in Xm Xs, now, or overdue. |
| Error | Error message from the previous failed attempt. Truncated with ellipsis in the table cell; hover to see the full text in a tooltip. |
When no retries are pending, the table is replaced with "No retries pending."
Run history table
Lists recently completed session attempts — both successful and failed. Shows the last 25 entries. This section appears only when run history data is available (requires persistence to be enabled).
| Column | Description |
|---|---|
| Identifier | Issue identifier. |
| Attempt | Which attempt number completed. |
| Status | Outcome of the attempt (e.g., completed, error, cancelled). |
| Workflow | WORKFLOW.md file used for this run. Shows an em dash when unavailable. |
| Started | RFC 3339 timestamp when the session started. |
| Duration | Wall-clock time from start to completion. Computed from the start and completion timestamps. |
| Error | Error message, if the attempt failed. Shows an em dash for successful attempts. |
Footer
The footer displays aggregate statistics across all sessions since startup:
| Element | Description |
|---|---|
| Agent runtime | Cumulative wall-clock time agents have spent running, formatted as Xh Xm Xs. |
| Input | Total input tokens consumed (comma-formatted). |
| Cache | Total cache-read tokens (comma-formatted). |
| Output | Total output tokens consumed (comma-formatted). |
| Auto-refresh | Reminder that the page refreshes every 5 seconds. |
Temporary unavailability
If the orchestrator's state snapshot fails (e.g., during shutdown), the dashboard returns HTTP 503 with a minimal HTML page that reads "Dashboard temporarily unavailable" and auto-refreshes in 5 seconds. No manual reload is needed.
If the Go template execution fails (an internal error), the dashboard returns HTTP 500 with a similarly minimal auto-refreshing error page.